The promised 20% saving from multimodal transport isn’t a simple switch; it’s the result of mastering the operational paradoxes that road-only logistics completely ignores.
- True cost-effectiveness is dictated by proximity to rail hubs (« Terminal Gravity »), not just mileage.
- Visibility gaps (« Data Black Holes ») are an inherent feature of mode-switching, requiring a new approach to tracking.
Recommendation: Instead of asking « Is rail cheaper? », start by auditing one key route for its terminal proximity and data integration challenges. That is the true first step.
As a UK logistics manager, you’re on the front line. You battle rising diesel costs, HGV driver shortages, and the constant pressure of delivery windows. You’ve built a reliable, if increasingly expensive, road-based network. So when consultants talk about moving freight to rail, it’s easy to be skeptical. You hear the broad promises of « greener transport » and « cost savings, » but your reality is one of tight schedules and complex operational demands. A failed delivery because of a new, unproven system is a risk you can’t afford.
The common advice to simply « use intermodal containers » feels hollow. It ignores the real-world complexities: the opaque costs, the fear of losing visibility when a container vanishes into a railhead, and the coordination effort that could erase any potential savings. You know that what works on a spreadsheet can fall apart at a depot at 3 AM.
This is where the conversation needs to change. The key to unlocking that 20% saving isn’t about blindly shifting boxes from a lorry to a train. It’s about fundamentally re-architecting the geometry of your supply chain. It requires understanding the powerful, often counter-intuitive, forces that govern multimodal efficiency. This guide isn’t about the platitudes; it’s a consultant’s look at the operational paradoxes you must master to make multimodal work for you, revealing the specific strategies that turn potential into profit.
We will dissect the core challenges that hold logistics managers back from embracing rail-road combinations. By exploring these pain points directly, this article provides a strategic framework for identifying profitable routes, maintaining visibility, managing costs, and building a more resilient, efficient UK supply chain.
Summary: A Strategic Guide to UK Multimodal Freight Savings
- Why Some Routes Benefit From Rail-Road Combination While Others Lose Money?
- How to Pack Goods Once for Road, Rail, and Sea Without Repacking at Each Stage?
- Why Do You Lose Track of Your Shipment Every Time It Changes Transport Mode?
- The Hidden Coordination Costs That Make Multimodal More Expensive for Small Shipments
- When to Book Rail Freight Slots: The 6-Week Lead Time Most Shippers Miss?
- How to Build 3 Alternative Route Options for Every Critical Supply Line?
- Why Your Tracking Shows « In Transit » for 5 Days Without Any Location Updates?
- Why Does Germany Move 20% of Freight by Rail While UK Manages Only 9%?
Why Some Routes Benefit From Rail-Road Combination While Others Lose Money?
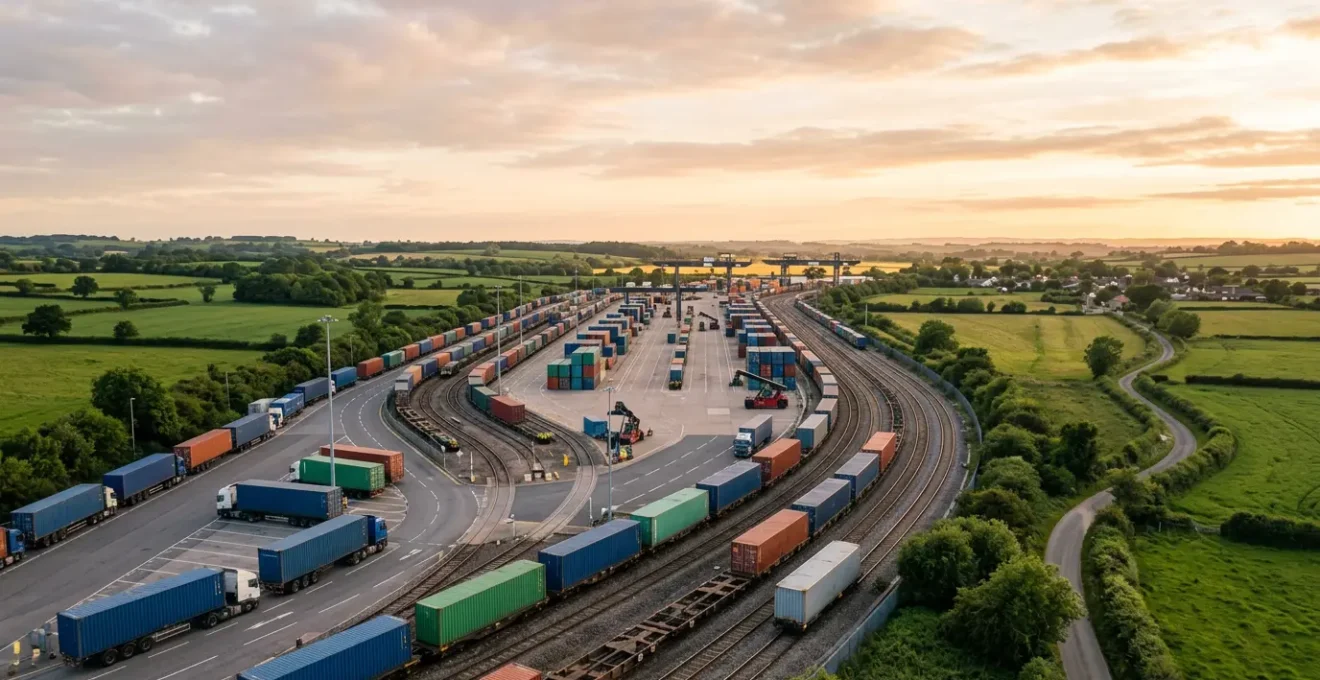
The single most common mistake in evaluating multimodal is focusing on total journey distance. The profitability of a rail-road route isn’t determined by how far it travels, but by a principle we can call « Terminal Gravity. » A rail-road terminal doesn’t just act as a switch point; it exerts an economic pull on the surrounding area. If your origin and destination points fall within the strong gravitational field of two well-connected terminals, you win. If they are too far outside it, the cost of the first and last-mile road haulage will negate any long-haul rail savings.
This concept is perfectly demonstrated by the UK’s own infrastructure. To understand how this works in practice, consider the design of the country’s most successful intermodal hubs. The underlying logic is always about minimising the road leg.
Case Study: The DIRFT « Terminal Gravity » Model
The Daventry International Rail Freight Terminal (DIRFT) exemplifies the ‘Terminal Gravity’ concept. Opened in 1997, its location was no accident. Situated on the West Coast Main Line and in immediate proximity to the M1 motorway and A45, the site was identified as a ‘motorway orientated growth point’ nearly two decades earlier. Its strategic positioning creates a powerful economic hub where the transition between road and rail is seamless and cost-effective. This demonstrates that a route’s viability is a function of its proximity to major road and rail interchanges, not just the line-haul distance.
The illustration below visualizes this principle. The closer a warehouse or distribution centre is to the central hub, the more cost-effective the multimodal solution becomes. The cost of road haulage to and from the terminal is the critical variable that determines whether you save money or lose it.

Therefore, your first step in assessing a route is not to look at a national map, but to map your key collection and delivery points against the locations of the UK’s major rail freight terminals. If a significant volume of your freight moves between zones that are both within a 50-100 mile radius of a major terminal, you have found a prime candidate for cost savings. If not, road-only will likely remain the more economical choice, regardless of the distance.
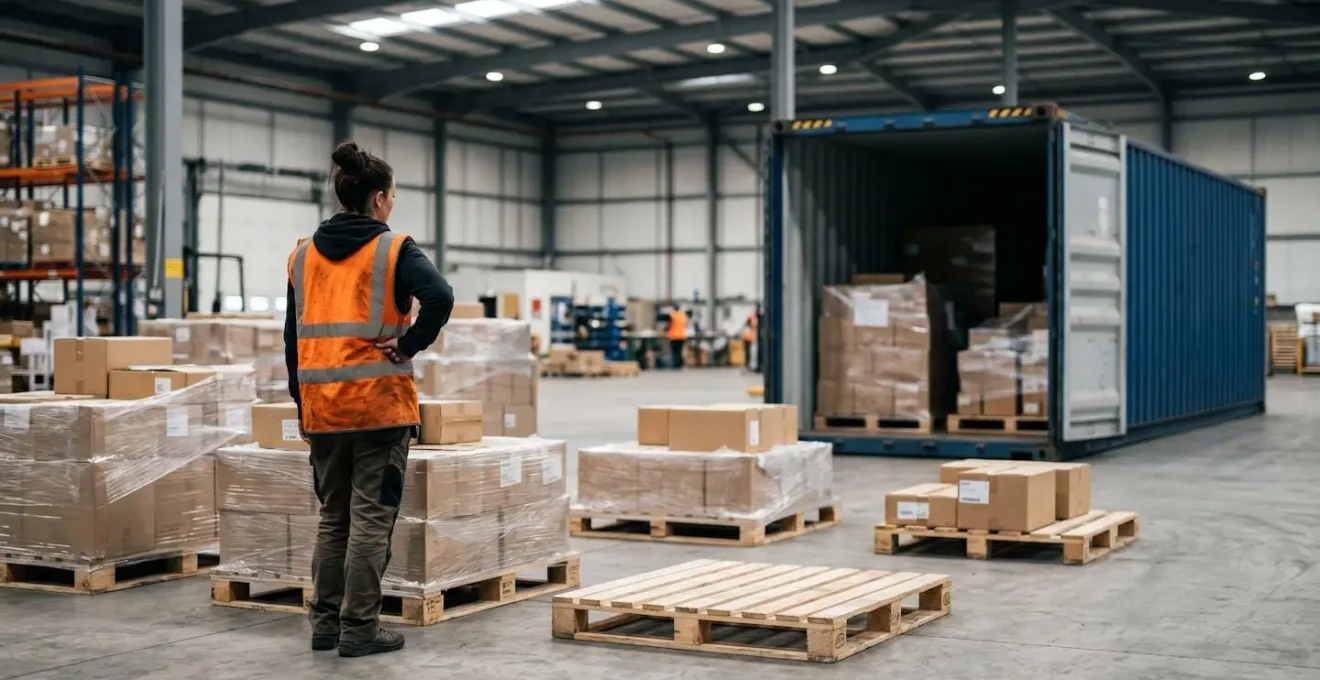
How to Pack Goods Once for Road, Rail, and Sea Without Repacking at Each Stage?
This question holds the key to multimodal efficiency, and the answer is both profoundly simple and operationally transformative: you must commit to the Intermodal Transport Unit (ITU) from the very first step. The entire global logistics system is built on this principle. The « how » isn’t a complex packing technique; it’s a strategic decision to ensure your goods are loaded into a standardized container—be it a 20ft ISO container, a 45ft pallet-wide container, or a swap body—at the point of origin and not unloaded until the final destination.
For a logistics manager accustomed to loading goods directly onto a lorry trailer, this represents a mental shift. You are no longer just booking a vehicle; you are moving a standardized box of volume. This box is agnostic to the mode of transport. The crane at the railhead, the chassis of the truck, and the gantry at the port all speak the same language—the language of the ITU’s corner castings and dimensions.
The act of « packing » therefore becomes « unitization. » You pack the container, seal it, and from that moment on, your focus is on the efficient movement of that unit. This eliminates costly and time-consuming transloading (moving goods from one transport mode’s container to another), reduces the risk of damage and pilferage, and dramatically simplifies documentation. By treating the container as the cargo, you unlock the ability to seamlessly switch between road and rail, leveraging the strengths of each without penalty. This systemic efficiency is a major driver behind the significant fuel savings seen in multimodal corridors.
Why Do You Lose Track of Your Shipment Every Time It Changes Transport Mode?
Your frustration is valid and widely shared. You watch a truck depart with your goods, its GPS tracked in real-time. Then it enters a rail terminal, and the signal goes dead. For days, the status is a vague « In Transit. » This is the reality of the multimodal « Data Black Hole. » The issue isn’t that your shipment is lost; it’s that the data systems tracking it are fragmented and don’t communicate with each other.
Each player in the logistics chain—the haulier, the rail operator, the terminal—has their own system. The handoff of the physical container is rarely matched by a seamless handoff of its tracking data. As the logistics platform FarEye notes, « When shipments move across multiple transport modes, tracking becomes a daily headache. Each carrier uses different systems. Data doesn’t sync. Visibility disappears at handoff points. »
This problem is compounded by the very nature of different transport segments. A road haulier’s telematics are designed for continuous, second-by-second updates. Rail and ocean transport, however, operate on different cadences. It’s not uncommon for visibility to be based on event-driven updates rather than continuous tracking. For example, cargo tracking analysis shows low update frequency, with vessels and trains sometimes updating their position only once every 6 to 12 hours. For a manager used to the granular detail of road telematics, this feels like flying blind. The solution lies not in better individual systems, but in platforms that can aggregate and interpret data from all modes into a single, unified view.
The Hidden Coordination Costs That Make Multimodal More Expensive for Small Shipments
The headline savings of multimodal transport are incredibly compelling. When you look at the cost per-ton-mile, rail is often dramatically cheaper than road for the long-haul portion of a journey. However, these savings are contingent on one critical factor: volume. For full container loads (FCL), the economics are clear. But for smaller, less-than-container-load (LCL) shipments, a new layer of complexity and cost emerges: coordination overhead.
This table breaks down the raw transport costs, showing that even with terminal handling, multimodal offers huge savings over road-only for a full unit. The key is that these figures assume an optimized, full load.
| Transport Mode | Cost Per Net Ton | Cost Savings vs Road-Only | Best Use Case |
|---|---|---|---|
| Road-Only (Truck) | $214.96 | Baseline (0%) | Short distances, flexible delivery points |
| Rail Direct | $70.27 | 67% savings | Origin and destination both on rail network |
| Multimodal (Rail + Truck via Terminal) | $95.54 | 56% savings | Long-haul with terminal access within 100 miles |
| Multimodal (with equipment costs) | $105.01 | 51% savings | Regular shipments justifying railcar investment |
The data, based on a comparative analysis of US freight costs, illustrates a universal principle. The savings of 50-60% are achievable, but they rely on efficiently filling a railcar or container. When you have only a few pallets, you enter the world of consolidation. Your shipment must be taken to a warehouse, grouped with other LCL freight heading in the same direction, and then loaded into a shared container. This process involves extra handling, storage, and administrative work—the « coordination overhead »—which can quickly erode the per-mile savings of the rail leg.
This is the central paradox for small shipments: the mode of transport is cheaper, but the process of accessing it is more expensive. For a logistics manager, the decision point is the break-even volume where the savings on the long-haul leg outweigh the added costs and complexity of consolidation. This requires a deep partnership with a logistics provider who has the network and volume to make consolidation efficient.
When to Book Rail Freight Slots: The 6-Week Lead Time Most Shippers Miss?
The idea of a rigid, six-week lead time for booking rail freight is one of the most persistent and misleading myths in UK logistics. While it’s true that some stable, high-volume routes operate on long-term schedules, the reality of the modern UK rail network is far more dynamic. The idea you must plan over a month in advance is often a barrier that prevents managers from even considering rail for more agile needs. The truth is more nuanced and presents both challenges and opportunities.
Rail paths on the UK network are a finite and contested resource. As Network Rail clarifies, freight operators are constantly bidding for slots against the needs of passenger services. This dynamic marketplace, not a static timetable, dictates availability and cost. Far from being locked in weeks ahead, Network Rail guidance confirms freight operators can bid for temporary paths at very short notice, sometimes just a few days in advance. This provides a level of flexibility that many shippers are unaware of.
However, this flexibility comes with a trade-off. A last-minute bid for a path on a congested line, like the West Coast Main Line, is likely to be more expensive and less certain than a slot booked on a regular, established service. The « 6-week rule » is less a rule and more a ghost of past practices. The modern strategy is not to adhere to a fixed lead time, but to work with a freight partner who has the expertise and scale to navigate the path-bidding system effectively. They will have a portfolio of core, stable paths and the market knowledge to acquire short-term capacity when needed. Your job isn’t to become a rail path bidder; it’s to find a partner who already is.
How to Build 3 Alternative Route Options for Every Critical Supply Line?
In a road-only world, contingency planning often means little more than finding a diversion around a motorway closure. In a multimodal system, building resilience requires a more structured approach. Relying on a single route, even an efficient one, exposes your supply chain to significant risk, from terminal congestion and equipment shortages to industrial action. The goal is to develop a multi-layered defence system by creating what we can call « Route Resilience Tiers » for every critical supply line.
This isn’t about having a vague « Plan B. » It’s about having pre-costed, pre-vetted, and operationally viable alternatives that can be activated with minimal delay. Tier 1 is your optimized, everyday route. Tier 2 is a planned deviation that protects you from localized disruption, perhaps using a different terminal or operator. Tier 3 is your emergency « scramble » option—the expensive but necessary fallback for catastrophic failures, which might even mean reverting to road-only for a short period. This structured thinking transforms resilience from a reactive scramble into a proactive strategy.
The following framework provides a concrete methodology for designing and implementing this three-tiered approach within the context of the UK’s logistics network.
Your Action Plan: Building a Three-Tier Routing Strategy
- Tier 1 – The Primary Route: Design the most cost-effective, optimized multimodal route using major terminals like DIRFT (Daventry), Hams Hall (Birmingham), or Trafford Park (Manchester) with connections to key ports like Felixstowe and Southampton.
- Tier 2 – The Diversion Route: Map an alternative multimodal route using different terminals or rail operators to mitigate localized disruption. For example, if your primary route uses GB Railfreight, plan an alternative with DB Cargo UK or Freightliner using different terminal access points.
- Tier 3 – The Scramble Route: Pre-cost a road-only or short-sea-shipping contingency option for total rail network failure scenarios, such as national strikes, severe weather on main lines, or extended terminal closures.
- Stress Test: Model each route option against specific UK disruption scenarios, such as a week-long closure of the M6 motorway, strike action at the Port of Felixstowe, or severe weather impacting the West Coast Main Line.
- Financial Integration: Calculate for each route not just the freight cost and transit time, but also the impact on safety stock levels, inventory carrying costs, and working capital requirements.
By systematically building and stress-testing these tiers, you are not just creating backup plans. You are quantifying the risk and cost associated with your most critical supply lines, allowing for more informed strategic decisions and ensuring that a single point of failure cannot bring your operations to a halt.
Why Your Tracking Shows « In Transit » for 5 Days Without Any Location Updates?
This is the most unnerving aspect of the « Data Black Hole » and a deeper issue than simple update frequency. The prolonged « In Transit » status with no new data points directly to the operational reality inside a multimodal terminal: a « scan-free zone » where your container is physically present but digitally invisible.
As GoComet Logistics Technology explains, the problem is most acute at the points of transition. « Multi-modal shipment visibility often breaks at the transitions as shipments move across multiple transport modes. Ports, airports, railyards, and warehouses operate on different systems, making it difficult to track the same container through every leg. » While your container is inside the terminal, it is undergoing a series of movements—unloading, stacking, waiting, shunting, and finally loading onto a train—that are managed by the terminal’s internal systems and are rarely broadcast externally in real-time.
The Terminal Black Hole: A Tracking Gap Analysis
Industry analysis reveals that when shipments move from truck to rail terminal, tracking information becomes fragmented or delayed. Inside rail terminals, containers undergo a process that can take several days: unloading from trucks, stacking in vast yards, waiting for a specific train slot, and final loading. For security and operational reasons, this area often operates as a ‘scan-free zone’ with no intermediate tracking updates. Most legacy systems are event-based: the ‘In Transit’ status is triggered by the last scan (e.g., ‘Gate Out’ from origin) and only changes at the next mandatory scan (e.g., ‘Gate In’ at destination), even if this gap spans multiple days. The challenge is that carriers struggle with tracking hand-offs, causing delays and disputes.
This macro view of container stacking illustrates the physical reality of the digital void. Your container is one among thousands, sitting in a precise but un-scanned location, waiting for its next scheduled move. The ‘In Transit’ status is technically correct—it is no longer at the origin and has not yet reached the destination—but it fails to provide the granular reassurance you are used to.

The solution requires a shift in expectation and technology. Rather than demanding constant GPS pings from a static container in a yard, modern visibility platforms work by integrating with the terminal’s own operating system or using predictive analytics based on the train’s scheduled departure. They fill the « black hole » not with a signal from the box itself, but with data-driven intelligence about the process it is undergoing.
Key Takeaways
- Terminal Gravity is Real: Profitability is determined by your proximity to rail hubs, not just the total distance of the journey.
- Data Black Holes are a Feature, Not a Bug: Expect visibility gaps at transition points and plan your tracking strategy around aggregating data, not just tracking a single vehicle.
- Structural Asymmetry Defines Limits: The UK’s rail freight potential is limited by physical infrastructure and network priorities compared to continental peers, making intelligent route selection even more critical.
Why Does Germany Move 20% of Freight by Rail While UK Manages Only 9%?
When exploring the potential of UK rail freight, it’s impossible to ignore the comparison with continental Europe, particularly Germany, which moves more than double the proportion of its freight by rail. It’s a stark difference that can lead to frustration. Why can’t the UK achieve the same? The answer isn’t a lack of ambition, but a deep-seated Structural Asymmetry in geography, history, and infrastructure.
First, the environmental and efficiency arguments for rail are universal. Network Rail data confirms rail freight’s CO2 emissions are 76% less than road per tonne, a powerful incentive. However, the ability to capitalize on this is constrained by a set of fundamental differences between the UK and German networks. Understanding these differences is crucial for setting realistic expectations for what UK multimodal can achieve.
This comparative table, drawing on publicly available data on European rail networks, highlights the core structural factors at play. It’s not about one country being ‘better’, but about two fundamentally different operating environments.
| Factor | United Kingdom | Germany (Context) | Impact on Freight Viability |
|---|---|---|---|
| Loading Gauge | Smaller historic tunnels and bridges prevent double-stacked containers | Larger clearances allow double-stacking, more economical operations | UK fundamentally capped on efficiency per train |
| Geographic Role | Island ‘destination’ market | Land bridge at heart of Europe with transit freight | Germany benefits from pass-through traffic dynamics |
| Market Structure | Fragmented, privatized (multiple competing operators) | Strong state-owned presence (DB Cargo) with strategic planning | UK: more competition but less coordinated investment |
| Network Priority | Passenger services almost always prioritized over freight | Freight often has dedicated lines or equal priority | UK freight faces limited paths, increased journey times, lower reliability |
| Rail Freight Market Share | ~9% | ~20% (comparative reference) | Structural factors limit UK growth potential |
For a UK logistics manager, this context is vital. You cannot operate on the German network, you must optimize within the British one. The smaller loading gauge means efficiency must be found elsewhere. The prioritization of passenger services means intelligent slot booking and resilient routing are non-negotiable. The UK’s status as an island destination means the focus is on internal distribution from ports, a different challenge from managing transit freight. Recognizing these constraints allows you to shift from asking « Why aren’t we like Germany? » to « How can we be the most efficient within the UK’s unique system? »
The path to unlocking a 20% cost saving is not a single decision but a series of strategic adjustments. It requires a new way of seeing your supply chain—as a geometric puzzle of terminals, a network of data flows, and a tiered system of resilience. By mastering these concepts, you move from being a manager of lorries to an architect of logistics efficiency. Your next step is to take this framework and apply it to your own operations. Start small. Pick one critical, high-volume route and audit it against the principles of Terminal Gravity and data integration. The insights you gain will be the foundation of your new, more efficient, multimodal strategy.