
The UK-Germany rail freight gap isn’t just about headline investment; it’s about operational intelligence and exploiting specific, often overlooked, network capabilities.
- True intermodal efficiency in the UK hinges on asset compatibility, where knowing which terminals handle 45ft containers and which lines clear hi-cubes is paramount.
- Economic viability is not universal. It’s determined by a strict viability threshold where distances over 250 miles and aggregated volumes make the rail-road switch profitable.
Recommendation: Shift from a blanket « rail-first » ambition to a surgical strategy, targeting specific, pre-vetted UK corridors where intermodal provides a proven cost and reliability advantage.
For any UK logistics strategist, the disparity is stark and persistent. Germany successfully shifts nearly 20% of its freight by rail, while the UK struggles to surpass 9%. The common narrative points to historical underinvestment and a fragmented network. While true, these are high-level diagnoses that offer little practical guidance. The typical advice to « go green » by switching to rail often ignores the complex operational realities on the ground: Which routes actually save money? Which terminals can handle modern equipment? Where does the promise of rail reliability break down?
This analysis moves beyond the generic debate. The core issue for a strategist isn’t a lack of will, but a lack of granular network intelligence. The potential for seamless goods movement in the UK is not found in nationwide averages but in the specific capabilities of individual terminals, the clearance profiles of certain lines, and the economic tipping points of particular routes. The key is not to think of the « UK rail network » as a single entity, but as a mosaic of opportunities and constraints.
This article provides that granular perspective. It is designed as an analytical toolkit for the logistics professional, revealing the specific operational levers that can make intermodal transport a competitive advantage. We will dissect the UK network to expose what works, where it works, and why, providing the capability-revealing data needed to build a truly effective and profitable rail-road strategy.
This in-depth analysis will explore the critical questions that determine the practical viability of intermodal freight in the UK. The following sections are structured to guide you through the specific capabilities and constraints of the network, helping you identify real opportunities for efficiency and cost reduction.
Summary: A Strategist’s Map to UK Intermodal Capabilities
- Which UK Rail Freight Terminals Can Handle 45ft Containers for European Trade?
- How to Use Swap Bodies to Move Loads Between Trucks and Trains Without Cranes?
- Rail Freight or Direct Trucking: Which Delivers On-Time More Reliably in the UK?
- Why Some UK Rail Lines Cannot Carry Hi-Cube Containers While Others Can?
- How Much CO2 Reduction Can You Report by Switching 30% of Road Miles to Rail?
- Why Some Routes Benefit From Rail-Road Combination While Others Lose Money?
- One Mega-Warehouse or Five Regional Hubs: Which Cuts Delivery Times by 40%?
- Why Does Combining Rail and Road Cut Your Cross-UK Shipping Costs by 20%?
Which UK Rail Freight Terminals Can Handle 45ft Containers for European Trade?
The ability to handle 45ft containers is a critical gateway to efficient European trade, yet not all UK rail terminals are created equal. The distinction lies in both the physical lifting equipment and, crucially, the gauge clearance of the connecting rail lines. A strategist must look beyond a terminal’s mere existence to verify its specific asset compatibility for these larger, more economical units. Terminals linked to ports and major logistics parks are the most likely candidates, having been upgraded to meet modern demands.
Major hubs like the Port of Felixstowe are at the forefront, with rail representing a significant part of their operation. The port’s infrastructure handles a massive volume, with 29% of its total throughput moving by rail, a figure that rises to 50% for traffic destined for the North and West Midlands. This is facilitated by 58 daily trains across three dedicated terminals, demonstrating a mature and high-capacity system geared for intermodal flows. The investment here directly correlates to capability.
Case Study: Grangemouth Terminal’s Gauge-Cleared Advantage
Scotland’s largest container port, Grangemouth, provides a clear example of targeted investment. Handling 250,000 TEUs annually, its equipment is specified for containers from 20ft up to 45ft. Critically for European trade, the terminal is rail-linked to both the East and West Coast main lines via infrastructure explicitly described as « free of any gauge constraints. » This offers a decisive advantage, removing a major bottleneck. The terminal’s weekend rail service to Tilbury, with a 36-container capacity, serves as a practical demonstration of its 45ft compatibility for cross-UK movements, making it a key strategic node for north-south flows.
For a logistics strategist, the takeaway is clear: a terminal’s name on a map is insufficient data. The key is to build a network map based on verified 45ft handling and gauge-cleared exit routes. This involves direct engagement with terminal operators like Forth Ports (Grangemouth) and DP World (London Gateway, Southampton) to confirm capabilities before committing freight.
How to Use Swap Bodies to Move Loads Between Trucks and Trains Without Cranes?
Swap bodies represent a significant leap in intermodal flexibility, fundamentally changing the requirements for terminal infrastructure. Unlike standard ISO containers that require heavy-lift equipment like reach stackers or gantry cranes, swap bodies are designed for horizontal transhipment. This technology allows a load to be moved laterally between a specially adapted truck trailer and a rail wagon, drastically lowering the barrier to entry for creating intermodal transfer points. It’s a system that prioritizes speed and minimal infrastructure, relying on the vehicle and wagon’s built-in mechanisms.
The process is elegant in its simplicity. A truck and train wagon park side-by-side. The swap body, resting on foldable legs, is unlocked from the truck chassis. A hydraulic or roller-based system then slides the entire unit across to the rail wagon, where it is secured. This removes the need for costly and space-intensive vertical lifting, opening up the possibility of creating transfer hubs in locations previously considered unviable. This is a key operational lever for expanding an intermodal network beyond the major terminals.
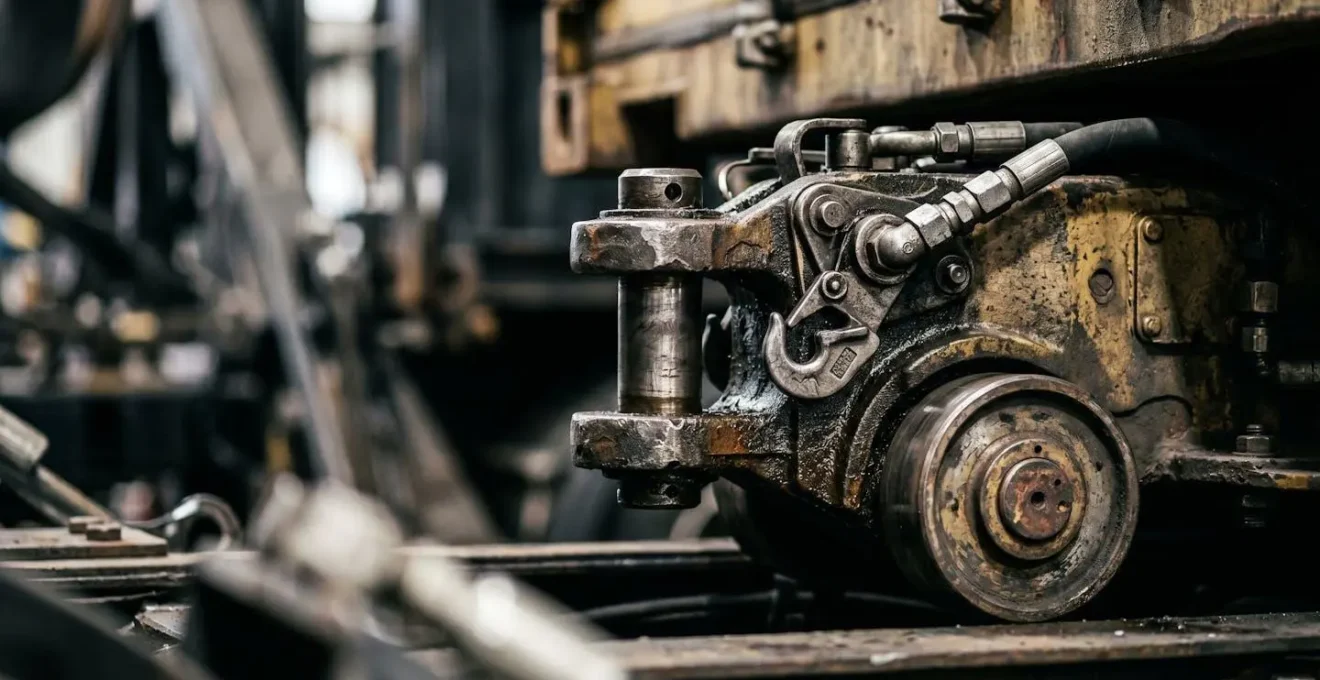
As the image above illustrates, the engineering is focused on the mechanical interface—the robust coupling and roller systems that manage the transfer. This focus on standardized, built-in mechanics is what enables the ‘craneless’ transition. For a strategist, this technology means that potential rail sidings or smaller logistics parks can be assessed not for their crane capacity, but for their ability to accommodate parallel truck and rail access.
Action Plan: Implementing Horizontal Transhipment for Swap Bodies
- Positioning: Align the road truck and railway wagon on parallel, level tracks or platforms equipped with compatible roller systems for smooth transfer.
- Verification: Ensure the swap body is equipped with standardized bottom frame fittings and foldable support legs compliant with DIN EN 283 standards for interoperability.
- Release: Disengage the locking mechanisms that secure the swap body to the truck’s chassis frame, preparing it for movement.
- Transfer: Activate the horizontal sliding mechanism, moving the swap body laterally from the truck to the rail wagon (or vice versa) without any vertical lift.
- Secure: Lock the swap body onto the rail wagon using its integrated twistlock systems, then retract the support legs to make it ready for transport.
Rail Freight or Direct Trucking: Which Delivers On-Time More Reliably in the UK?
The perception of rail freight reliability is often skewed by the high visibility of infrequent, major disruptions. However, for a logistics strategist, performance must be judged on data, not anecdotes. The critical metric is on-time performance (OTP), and here, UK rail freight presents a surprisingly robust case. It largely bypasses the chronic, unpredictable congestion that plagues the road network, offering a more stable and predictable transit time for long-haul journeys. While road haulage is subject to constant micro-delays from traffic, accidents, and driver hour limitations, rail runs on a fixed, scheduled pathway.
The data supports this. In the UK, rail freight services delivered trains within fifteen minutes of their booked arrival more than 90% of the time, according to quarterly statistics from the Office of Rail and Road. This level of punctuality is difficult to match with long-distance road transport, especially on congested corridors. This high degree of reliability is a core part of rail’s value proposition, allowing for tighter supply chain planning and reduced need for buffer inventory. The risk profile is different: rail faces a low probability of a high-impact delay (e.g., line closure), whereas road faces a high probability of low-impact, cumulative delays.
This comparative analysis from UK government data highlights the different risk profiles. A strategist must weigh the consistent performance of rail against the flexibility of road haulage, which can adapt to disruptions by rerouting. The choice depends entirely on the nature of the goods and the supply chain’s tolerance for different types of delay.
| Reliability Factor | Rail Freight | Road Haulage |
|---|---|---|
| On-Time Performance (within 15 min) | >90% | Variable (congestion-dependent) |
| Disruption Type | Infrequent but significant (line closures, infrastructure work) | Constant low-level variability (traffic, weather) |
| Real-Time Visibility | Limited (operator-dependent platforms) | Granular GPS tracking standard |
| Risk Profile | Predictable schedules, occasional major delays | Unpredictable micro-delays, rare major disruptions |
| Route Dependency | High (fixed infrastructure, gauge restrictions) | Flexible (alternative routing possible) |
Ultimately, for bulk, non-urgent goods moving between fixed points, rail’s proven on-time performance presents a compelling argument for making it the backbone of a national distribution strategy. The key is aligning the freight’s time-sensitivity with the appropriate mode’s reliability profile.
Why Some UK Rail Lines Cannot Carry Hi-Cube Containers While Others Can?
The inability of parts of the UK rail network to carry 9’6″ hi-cube containers is a perfect illustration of the concept of network granularity. It is not a universal failure, but a series of specific, localized constraints known as « gauge choke points. » The problem stems from the UK’s legacy as the world’s first railway nation; much of the infrastructure, particularly bridges, tunnels, and station canopies, was built to a smaller Victorian-era loading gauge. While many main lines have been upgraded, numerous feeder lines and regional routes remain restricted.
This creates a two-tier network. Strategic freight corridors, such as the West Coast Main Line (WCML) and routes connecting major ports like Felixstowe and Southampton to inland terminals, have often been cleared to W10 or W12 gauges, allowing for hi-cube containers on standard wagons. However, diverting from these main arteries can be impossible. The issue is one of vertical clearance. A hi-cube container on a standard flatbed wagon simply won’t fit under a lower, older bridge. This physical limitation is a hard barrier that no amount of scheduling or operational efficiency can overcome.

The image above visualizes the problem perfectly: the fixed, unchangeable arch of a bridge defines the absolute maximum size of any load that can pass. This is why specialized « low-liner » wagons have been developed, which carry the container lower down, sometimes between the bogies, to fit within the restricted gauge. However, this requires specialist rolling stock, adding cost and complexity. As UK rail freight analysis documents, these network bottlenecks and insufficient investment in catering for 9’6″ containers on standard wagons currently restrict growth.
For a logistics strategist, this means a route map cannot be a simple line between two points. It must be a three-dimensional problem, considering not just distance and terminals, but the vertical gauge clearance along every metre of the track. Before planning any intermodal flow involving hi-cubes, explicit confirmation of the route’s gauge compatibility from the freight operating company is non-negotiable. This is where the real work of intermodal planning lies: in the detailed, route-by-route validation of infrastructure capability.
How Much CO2 Reduction Can You Report by Switching 30% of Road Miles to Rail?
Quantifying the environmental benefits of a modal shift from road to rail is a critical component of modern corporate social responsibility (CSR) reporting. For a logistics strategist, moving beyond vague « greener » claims to reportable CO2 reduction figures is essential. Rail freight provides a clear and substantial advantage, generating around 76% less CO2 emissions per tonne-kilometre compared to road haulage. This efficiency gain is the foundation for any calculation.
The calculation for a specific business involves three key variables: the total tonne-kilometres of freight being moved, the percentage of that volume being switched to rail, and the standard emissions factors for each mode. By switching 30% of road miles to rail, a company can directly calculate the reduction in HGV journeys and the corresponding CO2 savings. This is not just a theoretical exercise; major hubs quantify this impact annually. For example, data from the Port of Felixstowe demonstrates over 100 million HGV miles are saved annually through its rail operations alone. This provides a tangible, reportable metric.
The national impact is equally significant and provides a powerful macro-level justification for modal shift. In the most recent period, an estimated 5.65 million lorry journeys were avoided in the UK by transporting freight by rail instead of road. A company’s individual effort to switch 30% of its volume contributes directly to this national reduction in congestion, road wear, and emissions. The key for reporting is to use recognized government or industry emissions factors to translate the reduction in HGV miles into a concrete figure of tonnes of CO2 saved, making the environmental benefit both measurable and communicable.
Therefore, a strategist can confidently build a business case for a 30% modal shift, not only on cost and reliability for suitable routes, but also on a robust and reportable CO2 reduction. This strengthens the strategic value of intermodal logistics, aligning operational efficiency with corporate sustainability goals. The savings are not just financial; they are environmental and reputational.
Why Some Routes Benefit From Rail-Road Combination While Others Lose Money?
The economic success of an intermodal rail-road strategy is not guaranteed; it is highly dependent on a specific set of route characteristics. The core principle is that rail’s economies of scale must be sufficient to overcome the additional costs and time associated with the ‘first mile’ and ‘last mile’ transfers at terminals. When a route hits this viability threshold, the combination is profitable. When it falls short, direct trucking remains the cheaper, more efficient option. Understanding these factors is the key to avoiding costly strategic errors.
Distance is the most critical factor. Rail freight becomes significantly more cost-effective on journeys over 250 miles, where the lower per-mile cost of rail haulage outweighs the fixed terminal handling charges at both ends. For short-haul routes under 150 miles, the overhead of two terminal lifts makes intermodal uncompetitive. Volume is the second pillar; rail thrives on aggregated flows of full container loads. Less-than-container-load (LCL) or low-volume shipments lack the scale to make the switch viable. UK government transport statistics show that while 28% of inter-modal road freight journeys begin or end at a rail terminal, these represent specific, high-volume flows.
The following table, based on common industry analysis, breaks down the characteristics that define the economic tipping point. A logistics strategist should use this as a checklist to evaluate the potential of any new route.
| Route Characteristic | Rail-Road Advantage | Road-Only Advantage |
|---|---|---|
| Distance | >250 miles (economies of scale) | <150 miles (no terminal overhead) |
| Volume | Full container loads, aggregated flows | Less-than-container-load (LCL) |
| Time Sensitivity | Non-urgent, predictable schedules | Express, just-in-time delivery |
| Terminal Access | Direct rail connection at origin/destination | Any location with road access |
| Commodity Type | Heavy, low-value bulk (construction, intermodal) | High-value, time-critical goods |
| First/Last Mile Cost | Minimized through hub proximity | Door-to-door single-mode efficiency |
In essence, the ideal intermodal route involves moving heavy, non-urgent goods in full container loads over a long distance between two points that are both in close proximity to a rail terminal. Any deviation from this ideal model increases the likelihood that direct trucking will remain the more economical choice.
One Mega-Warehouse or Five Regional Hubs: Which Cuts Delivery Times by 40%?
The choice between a centralized mega-warehouse and a decentralized network of regional hubs is a classic logistics dilemma. The ‘mega-shed’ model offers economies of scale in inventory management and warehousing operations, while regional hubs promise closer proximity to end customers and potentially faster final-mile delivery. However, when integrated with an efficient intermodal rail strategy, the centralized model can offer the best of both worlds: inventory centralization with sustainable and cost-effective long-distance distribution.
The key is to leverage rail for the ‘trunking’ leg of the journey—the high-volume, long-distance movement between the central warehouse and a series of smaller, rail-connected regional transfer points. From these points, final-mile delivery is completed by truck. This « hub and spoke » model, with a single large hub, allows a company to hold less total inventory compared to stocking five separate regional warehouses, significantly reducing capital and operational costs. It uses each transport mode for what it does best: rail for efficient, high-volume long haul, and trucks for flexible, responsive final-mile delivery.
Cutting delivery times by 40% is an ambitious target that depends heavily on the specific geography and customer distribution. A regional hub network might achieve this for a dense urban area, but the centralized model powered by rail can achieve similar or better service levels across a national scale, especially for predictable, scheduled deliveries. It transforms the mega-warehouse from a single distribution point into the heart of a national network.
Case Study: Tesco’s DIRFT-Based Domestic Intermodal Strategy
The domestic intermodal network operated by supermarket giant Tesco is a prime example of this strategy in action. The company uses the Daventry International Rail Freight Terminal (DIRFT) as a central mega-hub. A new service on the Daventry-Tees route, using 45ft containers, helped boost UK rail freight figures. This model demonstrates how a centralized inventory at a location like DIRFT can effectively feed multiple regional markets. Rail is used for the long-haul trunk movement, with trucks performing the final delivery from the destination railhead. This strategy combines the significant benefits of inventory centralization with sustainable, high-capacity, long-distance transport, proving the power of the rail-integrated mega-warehouse.
Key takeaways
- The economic viability of UK intermodal freight hinges on a viability threshold: routes must typically be over 250 miles with aggregated, full-load volumes to be profitable.
- Asset compatibility is non-negotiable. A route is only as strong as its weakest link, whether that is a terminal’s inability to lift 45ft containers or a bridge’s failure to clear a hi-cube container.
- Despite perception, UK rail freight offers superior on-time reliability (>90%) for scheduled traffic, making it ideal for non-urgent goods on long-haul corridors by avoiding road congestion.
Why Does Combining Rail and Road Cut Your Cross-UK Shipping Costs by 20%?
The headline promise of a 20% cost reduction by combining rail and road is not a universal guarantee but a achievable target on optimized routes. This saving is rooted in the fundamental economic differences between the two modes. Road haulage has high variable costs (fuel, driver wages, road user charges) but low fixed costs. Rail is the opposite: it has massive fixed costs (infrastructure, rolling stock) but significantly lower variable costs per tonne-kilometre, especially over long distances. Combining the two allows a strategist to leverage the best of both worlds, using road for its flexibility in the first and last mile, and rail for its cost-efficiency on the long-haul trunk.
The initial comparison between Germany and the UK is telling. Germany achieved a 20% rail freight modal share, comfortably above the EU average. As the Deutsche Bahn Competition Report notes, this growth is driven by performance, with rail transport increasing to 135.5 billion tonne-kilometres. In stark contrast, UK Department for Transport statistics show that in 2024, just 8% of domestic freight was moved by rail, compared to 82% by road. This gap is not just about policy; it’s about the successful exploitation of rail’s core economic advantages on a wider scale.
Rail freight transport performance in Germany increased by 0.8% to 135.5 billion tonne-kilometres in 2024, gaining 0.2 percentage points in market share to 20.1%. This growth was driven by non-DB railway undertakings.
– Deutsche Bahn Competition Report, Competition figures 2024/25
The 20% saving is realized when the long-haul distance is sufficient for rail’s lower variable cost to offset the double-handling costs at terminals. By aggregating volume onto a single train, you replace dozens of individual trucks, drivers, and fuel bills with a single, more efficient movement. This is the fundamental operational lever. For a UK strategist, closing the gap with Germany begins with identifying these specific long-haul, high-volume corridors where this cost arbitrage is most pronounced.
The next logical step for a UK logistics strategist is to move from analysis to action. This means applying this granular, capability-focused lens to your own freight flows. By mapping your current road movements against the network of gauge-cleared lines and 45ft-capable terminals, you can identify the specific routes where a switch to intermodal offers a clear and defensible competitive advantage in both cost and reliability.