Your slow-moving stock, potentially worth hundreds of thousands, is a direct drain on your working capital and financial health, not just a simple storage inconvenience.
- Effective inventory management focuses on SKU-level profitability and capital velocity, not just sales volume.
- Implementing rigorous, time-based decision points for stock is non-negotiable to prevent accumulation and protect margins.
Recommendation: Shift your strategy from reactive stock clearing to a proactive, data-driven process of capital reclamation.
That £200,000 of stock sitting dormant in your warehouse isn’t just taking up space; it represents a significant amount of trapped working capital that is actively eroding your business’s financial health. As an inventory manager, you are constantly advised to improve forecasting, run seasonal discounts, or implement a new warehouse management system. While these are valid considerations, they often miss the fundamental issue.
The real problem isn’t always the stock itself, but the financial metrics and operational discipline—or lack thereof—used to manage it. This isn’t a simple question of logistics; it’s a critical challenge of financial efficiency. The key is not merely to clear the shelves but to transform every piece of inventory into a cash-generating asset, preventing it from becoming a long-term liability. This requires a shift in perspective: from inventory management to active capital management.
This article provides a consultant’s framework for dissecting this problem. We will move beyond generic advice to provide specific, data-backed strategies for identifying profit-draining SKUs, making decisive actions on aging inventory, and optimising your warehouse operations to free up cash that can be reinvested into growing the business. It’s time to stop managing boxes and start managing capital.
Explore the following sections to understand the strategic levers you can pull to regain control of your inventory and turn dormant assets into active capital.
Summary: Why Your Warehouse Holds £200,000 of Stock That Has Not Moved in 6 Months?
- Why Should Fast-Moving Consumer Goods Turn 12x Yearly While Spare Parts Turn 2x?
- How to Focus 80% of Your Inventory Effort on the 20% of SKUs That Matter?
- Regional Hubs or Central Warehouse: Which Reduces Total Inventory Investment?
- Why Your « Long-Shelf-Life » Products Still Expire if Stored Wrong for 18 Months?
- When to Discount Slow Stock: The 90-Day Decision Point That Protects Margins?
- How Many Days of Safety Stock Do You Actually Need for Chinese Suppliers?
- How to Triple Pick Accuracy for £15,000 Without Full Warehouse Automation?
- Why Does Amazon Ship Same-Day When Your Warehouse Takes 3 Days to Pick the Same Order?
Why Should Fast-Moving Consumer Goods Turn 12x Yearly While Spare Parts Turn 2x?
The comparison between FMCG and spare parts inventory turns highlights a fundamental principle of working capital velocity. An FMCG turning 12 times a year means its associated capital is reinvested monthly, generating returns rapidly. In contrast, a spare part turning only twice means capital is locked in for six months at a time. For an automotive parts business, this slow velocity can be a silent killer of profitability. While it’s unrealistic to expect a crankshaft to sell like a can of beans, a turn rate of 2x is a clear signal of inefficiency and excessive inventory holding cost.
The goal is not to match FMCG rates, but to challenge the accepted norms for your specific industry. What is the optimal balance between availability and capital cost? According to industry analysis of spare parts KPIs, a good turnover ratio for this sector is actually between 5 and 10 times per year. A rate of 2x isn’t just slow; it’s significantly below the performance benchmark, indicating a substantial opportunity for improvement and capital reclamation.
Case Study: Automotive Manufacturer Boosts Capital Velocity
A leading automotive manufacturer saw its spare parts inventory turnover stagnate at a costly 2.5 times per year. By implementing advanced forecasting tools and enhancing supplier collaboration to shorten lead times, they systematically identified slow-moving parts and overhauled their purchasing strategy. Within just 12 months, turnover surged to 4.2 times per year. This move not only slashed holding costs but also freed up significant working capital for strategic initiatives while improving customer satisfaction through faster fulfillment.
This isn’t about arbitrary targets; it’s about understanding that every day an item sits on your shelf, it costs you money. Improving your turn rate from 2x to 4x effectively halves the time your cash is tied up in that inventory, a direct boost to your company’s financial liquidity.
How to Focus 80% of Your Inventory Effort on the 20% of SKUs That Matter?
The Pareto principle is a familiar concept, but its application in inventory management is often too simplistic. A basic ABC analysis based on sales volume alone is insufficient. It tells you what sells, but not what is profitable or what poses a financial risk. To truly focus your efforts, you need a multi-dimensional approach that segments inventory not just by value, but also by demand volatility and movement frequency. This is where an ABC-XYZ-FSN analysis becomes a powerful strategic tool.
This method categorises items across three axes:
- ABC Analysis: Based on consumption value (high-value ‘A’ items, low-value ‘C’ items).
- XYZ Analysis: Based on demand variability (stable ‘X’ demand, erratic ‘Z’ demand).
- FSN Analysis: Based on movement frequency (Fast, Slow, or Non-moving).
This creates a granular map of your inventory, revealing the true nature of each SKU. An item might be a low-value ‘C’ part, but if it has erratic ‘Z’ demand and is identified as ‘N’ for non-moving, it represents a high risk of becoming dead stock. This is the 20% of your inventory that is likely causing 80% of your capital blockage. This detailed segmentation allows you to apply different management strategies—such as just-in-time for AX items and a more cautious approach for CZ items—to optimise capital allocation across the board.
As the visualisation suggests, not all inventory is created equal. A strategic classification system allows you to allocate resources—time, space, and capital—with surgical precision, focusing on the SKUs that either drive profit or pose the greatest financial risk.
Case Study: Dealership Slashes Dead Stock with Multi-Dimensional Analysis
An automotive dealership was struggling with 37% overstock and 24% dead stock due to an inefficient categorization of its spare parts. By implementing an integrated ABC-XYZ-FSN classification method, they gained a precise understanding of part behaviour. This allowed them to pinpoint high-risk obsolete items, particularly those in the CZ-N class (low-value, erratic-demand, non-moving). This strategic approach led to a significant reduction in dead stock and enabled a prioritized management system based on actual inventory patterns rather than outdated, static demand models.
Regional Hubs or Central Warehouse: Which Reduces Total Inventory Investment?
The decision between a centralised distribution centre and a network of regional hubs is a classic supply chain dilemma with profound implications for your total inventory investment. The conventional wisdom, underpinned by a principle known as the « Square Root Law, » heavily favours centralisation. The law mathematically predicts the inventory reduction you can achieve by consolidating stock from multiple locations into one. The core idea is that pooling inventory allows you to manage demand variability more efficiently, as the unpredictable highs from one region are often balanced by the lows from another. This reduces the total amount of safety stock required.
The potential savings are compelling; theoretical models and research demonstrate that consolidating stock from ten locations into one can reduce overall inventory levels by over 68%. For a business with £200,000 in slow-moving stock, a reduction of this magnitude represents a massive release of working capital. However, this is a strategic decision that demands a layer of professional scepticism.
The law is a model, not a guarantee. It makes assumptions about demand patterns and doesn’t account for increased transportation costs to end customers from a single point, nor the risk of having all your inventory in one basket. As consultants Gerald Oeser and Pietro Romano point out in their research, the real-world application can be less straightforward.
The analysis reveals an average estimation error for total inventory of 27.85 per cent, with the SRL seeming to mostly overestimate inventory savings from centralisation.
– Gerald Oeser & Pietro Romano, International Journal of Retail & Distribution Management study on Square Root Law accuracy
The correct strategy, therefore, is not to blindly follow a formula but to use it as a starting point for a deeper analysis. You must weigh the undeniable benefit of reduced inventory investment against the increased outbound shipping costs and potentially longer delivery times for certain customers. The optimal solution may even be a hybrid model, with a central warehouse for slow-moving parts and regional hubs for fast-movers.
Why Your « Long-Shelf-Life » Products Still Expire if Stored Wrong for 18 Months?
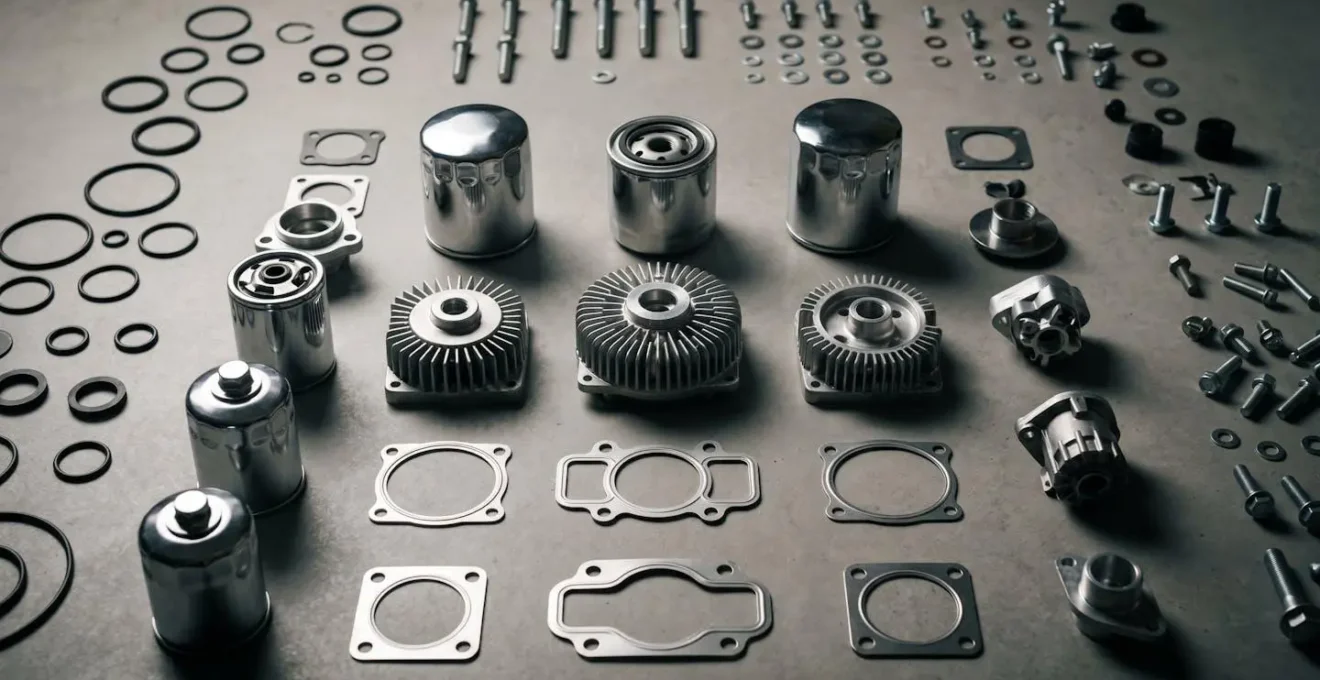
The term « long-shelf-life » can instill a false sense of security. For ambient goods like many automotive parts—gaskets, seals, electronic sensors—the enemy isn’t spoilage in the traditional sense, but gradual degradation. An O-ring that sits in a hot, dry corner of the warehouse for 18 months may look fine, but its material properties may have changed enough to cause a catastrophic failure upon installation. This transforms a perfectly good part into a worthless, and potentially dangerous, piece of junk. This form of « expiration » is a hidden drain on your working capital.
The value of your inventory is not static; it is constantly under threat from environmental factors. Humidity can corrode metal parts, temperature fluctuations can degrade rubber and plastics, and dust can contaminate sensitive components. Without proper environmental controls and storage discipline, you are essentially accelerating the depreciation of your assets. That £200,000 of slow-moving stock isn’t just sitting there; it’s losing value every single day it is stored incorrectly.
Protecting this value requires a proactive, disciplined approach to warehouse organisation and control. It’s not about having a pristine facility for its own sake; it’s about preserving the capital you have invested in your inventory. This means treating the warehouse environment as a critical component of your inventory management strategy.
Action Plan: Implementing Environmental and Organisational Controls
- Inventory Location Tracking: Know precisely where every part goes. Maintain 100% visibility in both the physical space and your inventory management software.
- Centralised & Labelled Storage: Consolidate similar parts and implement a comprehensive labelling system using durable labels. Ensure part numbers and storage dates are clearly visible.
- Technology-Driven Record Keeping: Replace manual logs with a robust part management software to handle receiving, transfers, and write-offs accurately and efficiently.
- Controlled Storage Environments: Maintain clean, organised storage spaces with appropriate temperature and humidity controls to prevent the degradation of sensitive components like rubber and electronics.
- Regular Stock Audits: Conduct systematic, regular inventory checks to identify aging parts long before they reach a point of critical degradation or become unusable.
By implementing these controls, you shift from a passive storage mindset to one of active asset preservation, directly protecting the capital tied up in your stock.
When to Discount Slow Stock: The 90-Day Decision Point That Protects Margins?
The decision of when to take action on slow-moving stock is a difficult balancing act between protecting margins and freeing up capital. Holding on too long means your carrying costs eat away at any potential profit, while discounting too early sacrifices revenue. The key is to replace emotional decision-making with a structured, time-based « decision cadence. » The 90-day mark is a powerful initial trigger point. If a non-seasonal item hasn’t sold in 90 days, it must be flagged for review. This isn’t a trigger to immediately liquidate, but a non-negotiable prompt to investigate: Is it a forecasting error? A pricing issue? Or is it a candidate for future obsolescence?
This disciplined review process must escalate over time. A part unsold at 180 days requires a more aggressive action plan. By the time an item reaches 18 to 24 months with no sales, it has crossed a critical threshold. At this point, industry data shows that parts are often classified as « dead stock. » For many large dealerships, this category can represent 10% or more of their entire parts inventory value, tying up millions in unproductive assets. Waiting this long to act is a failure of process.
A proactive disposition strategy is essential for capital reclamation. This isn’t just about selling off old stock; it’s a structured process to recover as much value as possible before an item becomes a total write-off. An effective strategy includes several key steps:
- Establish Clear Stocking Rules: Define minimum and maximum stocking levels for all SKUs, considering seasonality and supplier lead times.
- Leverage Supplier Policies: Actively work with suppliers on their stocking and return policies to minimise your own inventory liability.
- Systematically Monitor Zero-Sales: Run reports to track items that have not sold in 9, 12, or 18 months and assign clear actions for each category.
- Create a Disposition Plan: Develop a formal process to sell off, return, or scrap dead stock based on its age, value, and return eligibility. Items ordered in error should be returned immediately.
- Implement Regular Cycle Counting: Use rotating stock takes or, at minimum, a full annual inventory count to ensure your data is accurate and problems are identified early.
By systemising the decision-making process, you remove the guesswork and emotion, ensuring that actions are taken at the right time to maximise capital recovery and protect overall profitability.
How Many Days of Safety Stock Do You Actually Need for Chinese Suppliers?
Calculating safety stock is not about picking a number out of thin air; it is a calculated risk management decision. This is especially true when dealing with suppliers from distant locations like China, where lead times are long and variability can be high. The classic safety stock formula considers two primary variables: demand variability (how much your sales fluctuate) and lead time variability (how reliable your supplier’s delivery date is). For Chinese suppliers, the lead time component often dwarfs all other factors.
A 30-day sea freight journey can easily become 45 or 60 days due to port congestion, customs delays, or production issues. A « 30-day » safety stock based on demand alone would leave you exposed and facing a stock-out. Therefore, your calculation must be heavily weighted towards lead time uncertainty. The first step is to stop thinking in terms of averages. You need to meticulously track your actual lead times for each supplier over the last 12-18 months. What was the shortest lead time? What was the longest? The difference between your average lead time and your maximum observed lead time is your risk window.
This is the core data you need for your calculation. A common formula is: `(Maximum Daily Usage × Maximum Lead Time in Days) – (Average Daily Usage × Average Lead Time in Days)`. This ensures you have enough stock to cover the worst-case scenario—a surge in demand coinciding with the longest possible delivery delay. This isn’t about overstocking; it’s about building a precise, data-driven buffer that ensures supply chain resilience while tying up the minimum necessary working capital.

Each component in your supply chain has a different level of risk and variability. Your safety stock should be a tailored, calculated buffer, not a one-size-fits-all guess. It is the price you pay for continuity, and it must be calculated with the same rigour you apply to any other financial investment.
How to Triple Pick Accuracy for £15,000 Without Full Warehouse Automation?
For many warehouses, the idea of achieving 99.9%+ picking accuracy seems to require a multi-million-pound investment in full automation. The reality is that significant, near-perfect accuracy can be achieved with surprisingly modest investments in technology-assisted solutions. A single mispick is not a minor inconvenience; it is a costly error that ripples through your operations, involving returns processing, customer service time, redelivery costs, and reputational damage. The cost to correct a single error is often estimated at over £100.
If your warehouse has a 99% accuracy rate—which sounds respectable—it means 1 out of every 100 picks is wrong. For a facility processing 6,000 picks a day, that’s 60 errors daily, costing a potential £6,000 every single day. This is where targeted, low-cost technology provides a massive return on investment. Systems like pick-to-light, which uses illuminated displays to guide pickers to the correct location and quantity, can be implemented in high-volume zones for a fraction of the cost of full automation. The impact is immediate and dramatic.
Case Study: The £1.4 Million Savings from a 0.9% Accuracy Boost
A distribution facility processing 6,000 SKUs daily with a 1% mis-pick rate was facing annual losses of over £1.5 million, assuming a £100 correction cost per error. By implementing modest accuracy improvements—including basic barcode scanners, better storage zone organisation, and enhanced picker training—they raised their accuracy from 99% to 99.9%. This small shift reduced daily errors from 60 to just 6, slashing daily losses from £6,000 to £600. Over a year, this reclaimed £1.4 million in revenue, proving that the investment in basic accuracy tools can pay for itself within months.
Similarly, voice picking systems provide operators with verbal instructions via a headset, confirming tasks with spoken commands. Both technologies drastically reduce cognitive load and human error. As research on technology-assisted picking methods demonstrates, pick-to-light systems can achieve accuracy rates above 99.9% while increasing productivity by 30–50%. Voice picking achieves similar accuracy and boosts pick rates by 10–25%. An investment of £15,000 in a pick-to-light system for your 20% fastest-moving SKUs could eliminate the vast majority of your picking errors and deliver an ROI in under a year, directly improving your bottom line.
Key Takeaways
- Inventory performance is measured by capital velocity (turn rate), not just sales.
- A multi-dimensional SKU analysis (ABC-XYZ) is essential to identify true profit-drivers and capital drains.
- The value of « long-shelf-life » stock is not static; it degrades without proper environmental control.
- Picking efficiency is not just an operational metric; it’s a primary driver of warehouse costs and customer satisfaction.
Why Does Amazon Ship Same-Day When Your Warehouse Takes 3 Days to Pick the Same Order?
The gap between Amazon’s same-day delivery and a typical warehouse’s three-day pick-and-pack cycle feels like a technology gap, but it’s fundamentally a process and efficiency gap. Amazon’s advantage isn’t just about robots; it’s about an obsessive focus on optimising the single most expensive activity in any warehouse: order picking. The time your pickers spend walking through aisles is the largest component of this cost. In fact, Georgia Institute of Technology research confirms that order picking accounts for approximately 55% of all warehouse operating costs, with travel time being the biggest single contributor.
While your warehouse may not have Amazon’s budget, you can adopt its core principle: minimise travel time at all costs. A three-day pick cycle is often a symptom of a poorly optimised process. Pickers are given one order at a time, walking the entire length of the warehouse for a single item, then returning to the packing station. This is batch picking in its least efficient form. Amazon, in contrast, uses sophisticated algorithms to cluster orders and optimise pick paths, ensuring every step a worker takes is as productive as possible.
You can achieve significant improvements without a massive tech overhaul. Implementing strategic slotting—placing your fastest-moving items closer to the packing station—is a simple first step. Adopting a batch or cluster picking strategy, where a picker collects items for multiple orders in one trip, can drastically reduce travel distance. As the following comparison shows, even basic optimisations can have a profound impact on efficiency and labour costs.
This table illustrates the performance gains from moving beyond manual methods. The data, based on industry analysis, shows how strategic changes can directly impact key warehouse metrics.
| Metric | Manual Picking (Baseline) | Slotting Optimization | AI-Optimized Routing |
|---|---|---|---|
| Pick Rate (items/hour) | 60-80 | 85-95 | 120+ |
| Travel Distance Reduction | Baseline | 40-60% reduction | Up to 30% additional reduction |
| Implementation Timeframe | N/A | 2-4 weeks | 2-4 weeks |
| Annual Labor Savings (20 pickers at $30/hr) | Baseline | ~$40,000 | ~$50,000 |
| Combined Total Walk-Time Reduction | 0% | 40-60% | 35-60% |
The lesson from Amazon is not that you need more robots. It’s that you must treat every step your pickers take as a direct cost to the business. Reducing that travel time is the single most effective way to close the gap and improve your warehouse’s picking efficiency.
The £200,000 of dormant stock is a symptom of systemic issues in inventory strategy and warehouse processes. By shifting your focus from simply storing items to actively managing working capital, you can begin to solve the problem. Implement a disciplined, data-driven approach to SKU analysis, stock lifecycle management, and operational efficiency. The first step is to conduct a thorough audit of your current inventory based on these principles to identify where your capital is truly trapped.